Under Construction: This site is actively being built. New features, indicators, and pages are coming soon. Some parts may be incomplete — thanks for your patience!
For decades, people said markets were random (“A Random Walk on Wall Street”) or pure emotion. We believe they’re structured, interconnected, and predictable. Convergence reveals those hidden links and makes them usable.
There are plenty of portals that aggregate data, stream tickers, and offer standard analytics. We’re not trying to mimic or replace them. Convergence looks at markets from a different angle — turning interconnections into probabilities and hidden structures into clear narratives. Treat it as one more tool in your toolset to make sense of complexity.
Markets aren’t pure chaos. Beneath the noise lies logic, structure, and patterns that Convergence surfaces in real time.
Assets don’t move alone. Currencies, equities, and crypto impact each other — our platform shows those relationships clearly.
Proprietary signals generated from streamed, pre-digested data combined from multiple sources — distilled into charts that actually make sense.
Knowledge should be open. Convergence’s core indicators and portal are available at no cost — empowering anyone to see markets differently.
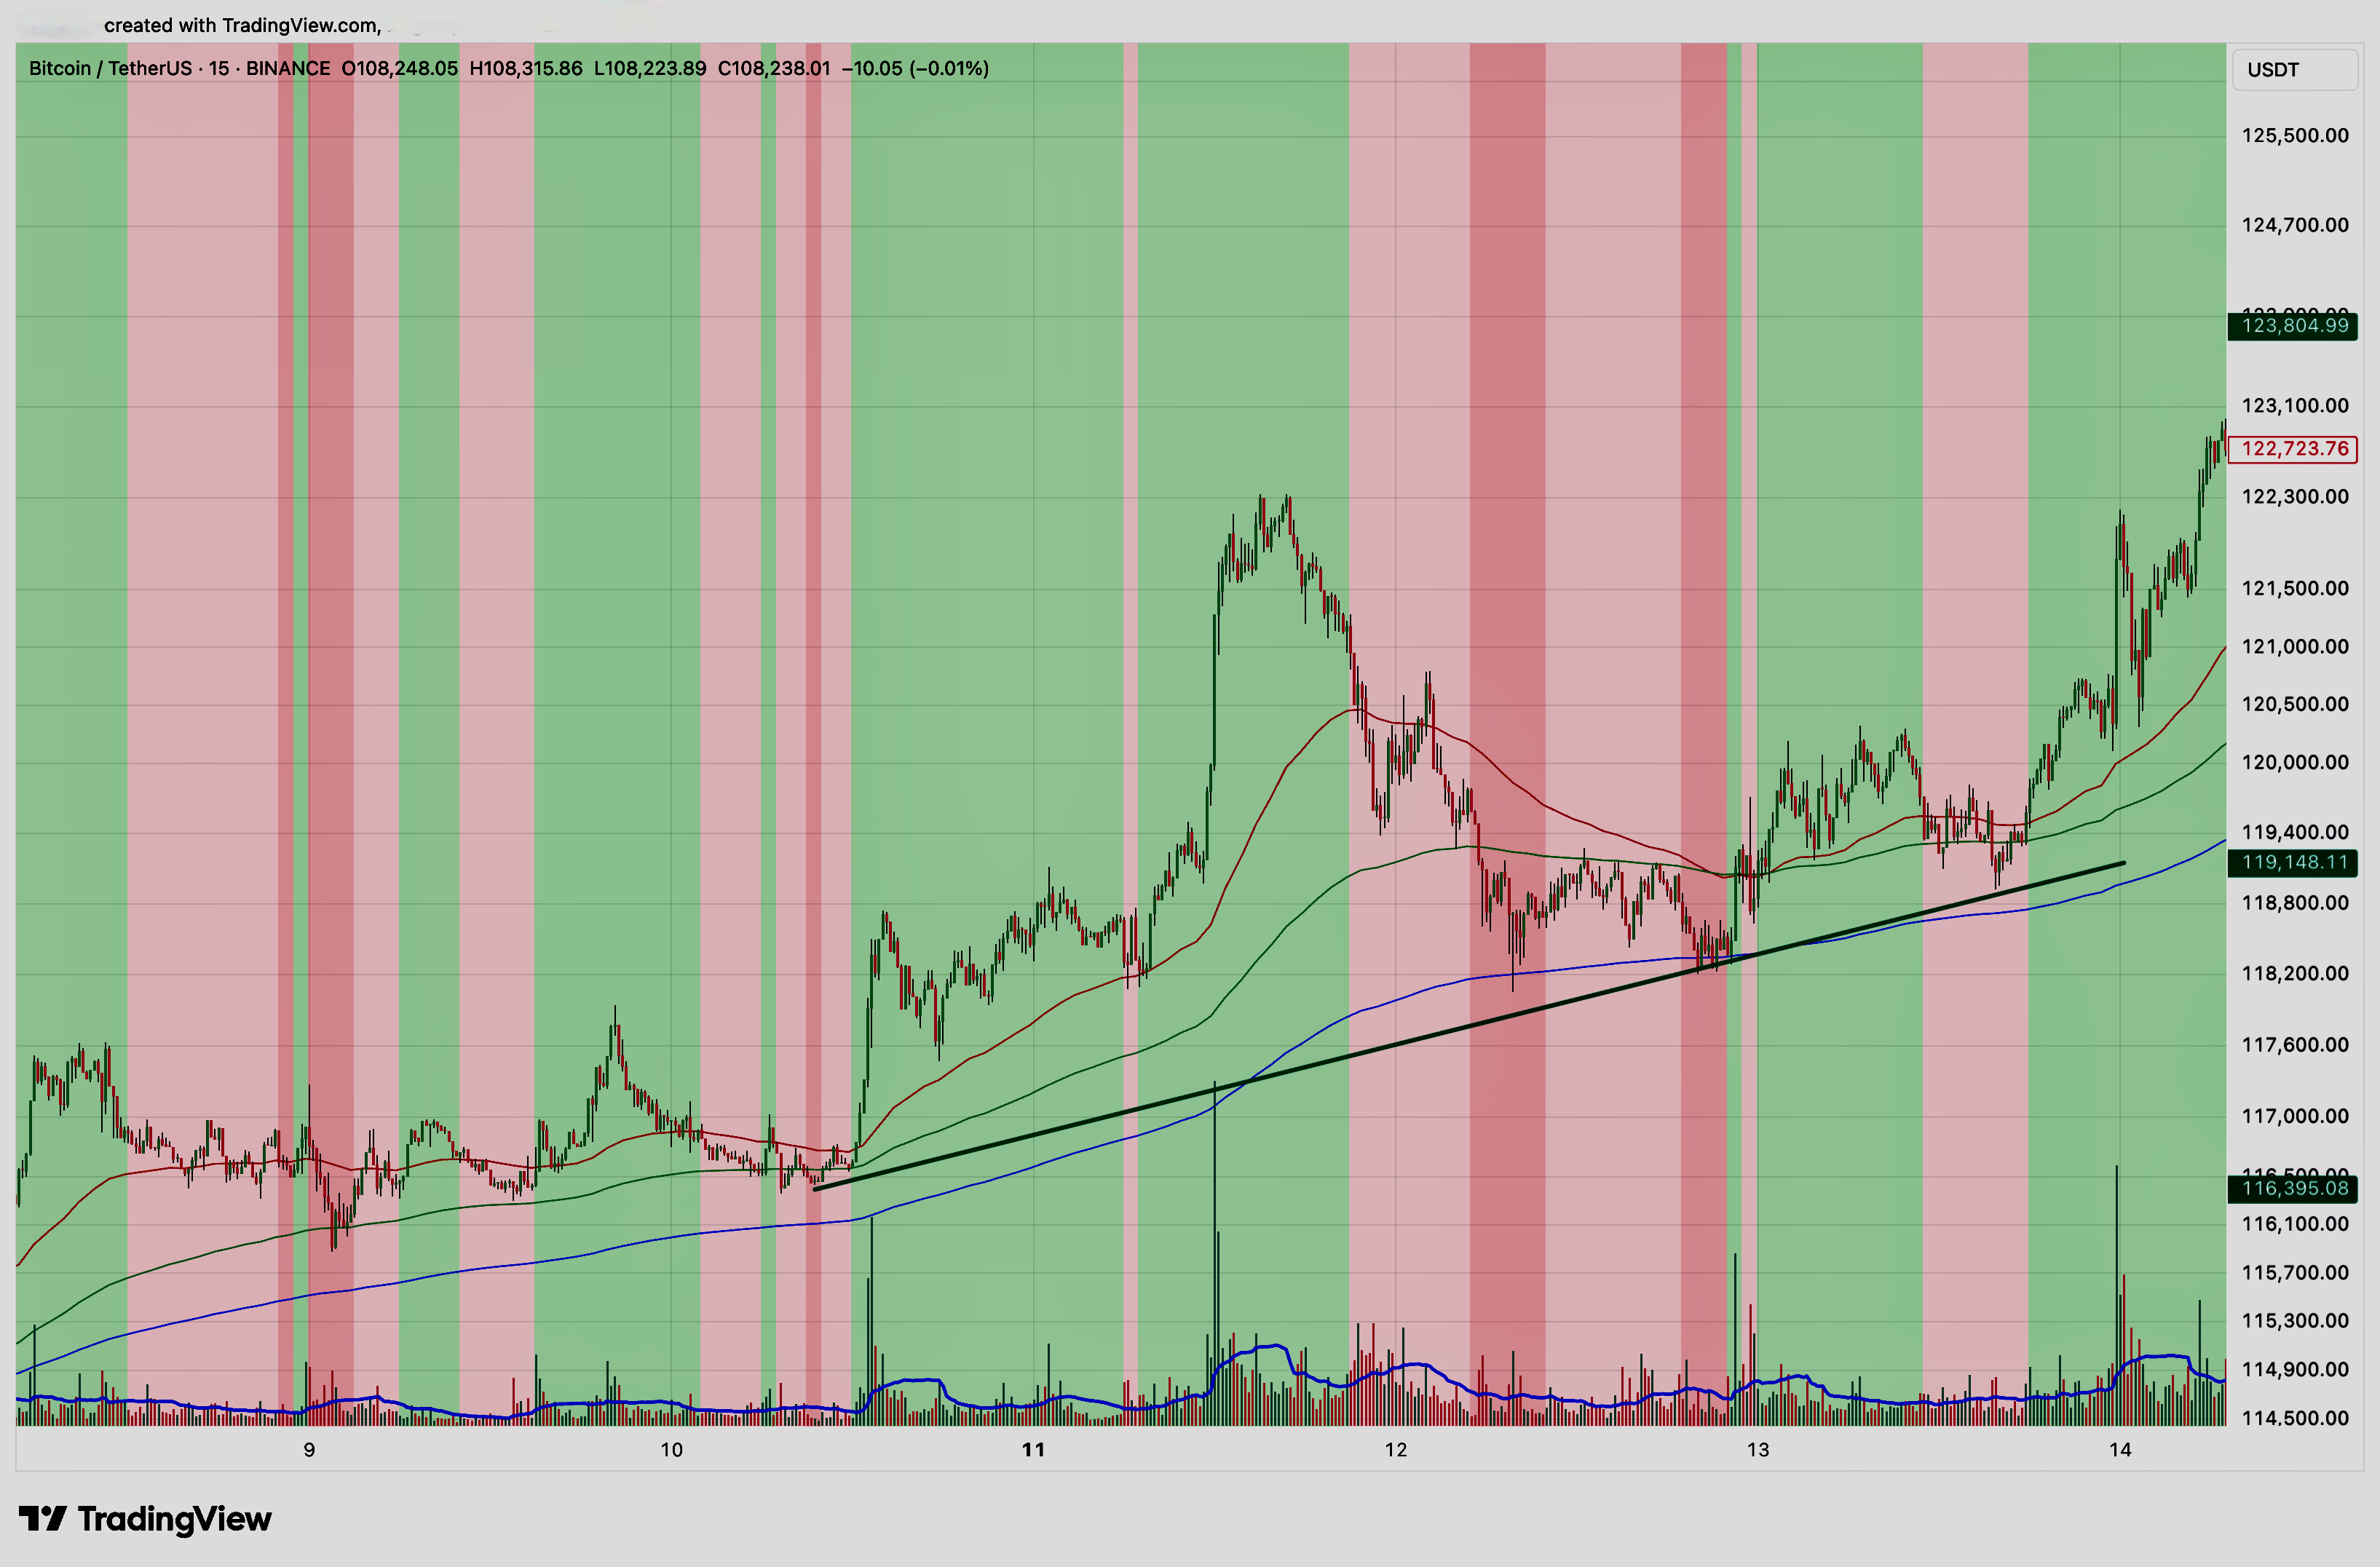
Convergence uses TradingView to display data on charts, providing advanced tools to enhance your market research. With TradingView's charts, you can easily follow BTCUSDT price in real-time, along with other currency pair rates. These interactive charts come with handy tools and a simple interface, making it easier to analyze data and make informed decisions.
Under the hood, Convergence is a streaming engine, a pattern detector, and a storyteller rolled into one. We don’t just dump raw charts at you — we process, connect, and reassemble data so the picture finally makes sense.
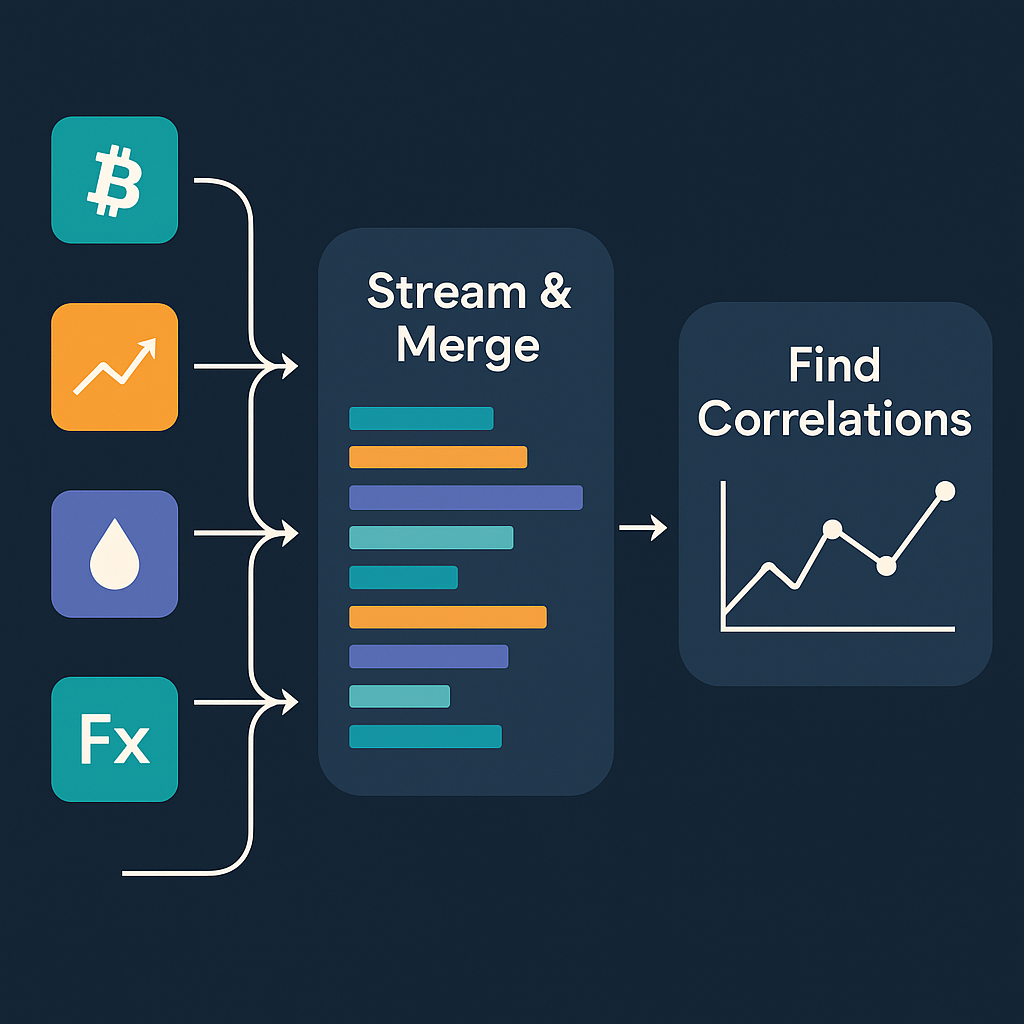
It starts with the firehose. Crypto, equities, commodities, FX — dozens of exchanges and feeds, all streamed live into our system. Think Kafka connectors pulling candlesticks, order books, and volumes into a unified river of events. Every tick, every candle, every move is captured.
Raw feeds are messy: different formats, time zones, quirks. Convergence chews through it all. We normalize timestamps, align timeframes, and calculate base indicators on the fly.
Here’s the fun part. We look for relationships. Maybe gold leads tech stocks. Maybe Bitcoin sneezes and altcoins catch a cold. Convergence finds these subtle dependencies by cross-analyzing streams in real time.
Instead of staring at a chaos of candles, you get a distilled story. Indicators aren’t just RSI and MACD clones; they’re custom composites built from multiple sources, pre-digested into signals.
The Convergence portal is open and free to use. Because insight should be accessible.
Take me to the charts!